Darwinian Medicine (continued from friday)
The Modes of Natural Selection
Selection Differential and Response to Selection
Heritability, Selection Differential, and Response to Selection
The WHO estimates that 23 million people were infected with the HIV virus in 1996.
The HIV virus is a retrovirus (RNA virus) responsible for indirectly producing a disease known as AIDS.
Briefly, the virus accomplishes this by infecting a key player in the vertebrate immune system called helper T cells.
By infecting helper T cells, our body's own immune system responds and ends up destroying our T cell population over time.
A lot of excitement was generated about 10 years ago by an AIDS drug called AZT (azidothymidine).
Coupled with the high mutation rate, we can estimate that the HIV virus can evolve over a ten year period to the same extent that humans can over a period of a million years!
Conclusion: no single drug can halt HIV infection - multiple drugs
can, though.
I will also summarize the processes on the board.
| Occurs where? | Magnitude determined by | Relative Effect in a small population | Relative Effect in a large population | |
| Selection | within | w | very strong | very strong |
| Mutation | within | u | weak | weak |
| Random Drift | within | Ne | moderate | weak |
| Gene Flow | among | m | strong | strong |
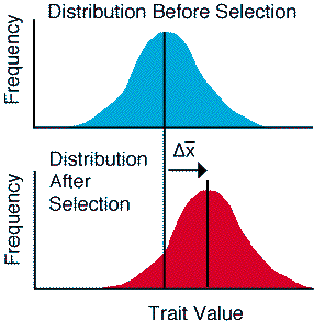
Directional selection is the easiest mode of selection to visualize. Directional selection is the natural analogue of artificial selection, which is practiced in the laboratory or cultivated field. We can compare the mean of the phenotypic frequency distribution before and after a selective episode (e.g., that leads to mortality). If we see a shift in the mean for the trait (either up or down), the trait is under directional selection.

Figure Legend. The action of directional selection on phenotype.
Directional selection also has a unique effect on the population -- it leads
to an evolutionary response to selection that
changes the mean of the trait from one generation to the next if the trait
has a heritable component. The change in the mean across generations reflects
the pattern of evolutionary change. However, we must ask about processes
that underlie this change. How do we relate the pattern seen as a change
in the distribution before and after selection to the process of natural
selection?
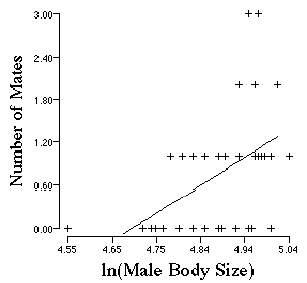
Figure Legend. Episodes of selection in the male bull frog. (From Arnold and Wade 1984, data from Howard 1979). The first event (W1) is mating. Fitness was defined as the number of females with which a male mated. The regression line is significant (P<0.05). We would expect chance alone to produce this strong a relationship less than 1 time in 20.
Returning to the process of adaptation, evolution reflects a genetically-based change in phenotypic traits over time. Humans have practiced artificial selection to "improve" cultivated plant and animal stocks for millennia and artificial selection has produced spectacular departures of cultivars from their original native varieties. The process of domestication leads to striking changes in behavioral and morphological traits. Darwin (1859) devoted an entire chapter in "The Origin of Species" to the subject of artificial selection. In his mind, artificial selection and the production of domesticated animals and plants was a powerful analogy for the action of natural selection.
Since Darwin's time, artificial selection has been practiced in laboratory populations in an attempt to simulate the slow process of natural selection, and serve as an experimental model of evolution. In an artificial selection experiment, the researcher typically applies a truncation point or threshold value (Fig. 3.1). Animals above or below this value are used to propagate the line. A useful measure of the amount of selection during a given generation is the difference in the mean between the phenotype distribution before and after selection, but before the next generation of progeny is produced. The selection differential describes the strength of selection relative to the distribution or variance of the phenotypic trait (Falconer, 1981). The selection differential compares the mean of the population before or after selection:
| s = mean after selection - mean before selection. | Eqn 1 |
If the phenotypic distribution of the trait is due to a large number of polygenic loci, then response to selection is a function of both the heritability of a trait (e.g., additive genetic variance) and the strength of selection on the trait (e.g., selection differential). With either low heritability or weak selection, response to selection is slow compared to strong heritability or strong selection. Response to selection is given by:
| R=heritability s | Eqn 2 | |
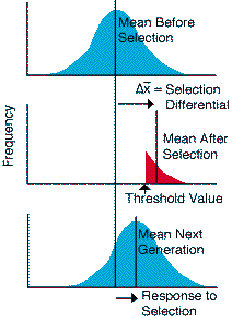
Figure Legend. Schematic illustrating the design of an artificial
selection experiment with truncation selection for large values of
the phenotypic trait. Only individuals with values of the phenotypic trait
greater than the threshold value are allowed to propagate the next
generation. The change in means within a single generation caused by truncation
selection is referred to as the selection differential. The change
in means between generations is referred to as the response to selection.
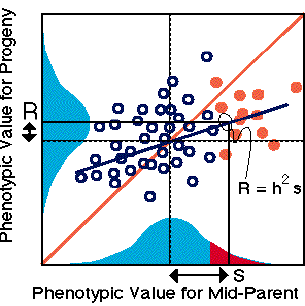
The effects of truncation selection across generations acts via heritable variation and we can visualize selection in terms of the relationship between parents and offspring. Assume that only parents with very large phenotypic values are allowed to breed. The selection differential, s, is the difference in mean of the selected parents versus to unselected parents (red vs red+blue distributions on the horizontal axis). The response to selection, R, is the change in mean of the progeny distribution relative to parents. Response to selection will always be less than the selection differential because, h2, the slope of the line is less than one, or the proportion of phenotypic variation explained by additive genetic causes should be less than one. Another way to think about the relationship between R, h2, and s is to predict R (the rise in the progeny generation) as a function of the s (the run), where rise over run is the slope (h2). The rise is a function of the run times the slope or R = h2 x s.
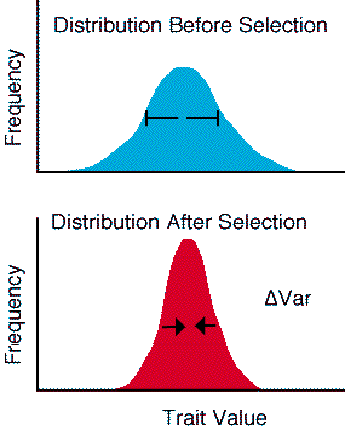
Figure 3.7. The phenotype is also stabilized by selection. Stabilizing selection tends to reduce the amount of variation in the phenotype distribution over an episode of selection. Individuals in the center of the phenotype distribution tend to be favored and have higher fitness than individuals in the "tails" of the distribution. A simple form of disruptive selection would act on a single locus with two alleles where overdominant heterozygous individuals have an advantage relative to the two homozygous classes. If the heterozygotes had higher fitness, selection would tend to remove the extreme homozygous classes.
In contrast, to the response to selection seen in the case of directional
selection, pure stabilizing selection does not change the mean of the phenotype
distribution. Stabilizing selection reduces variation and favors individuals
with an average phenotype over the extremes. This mode of selection is often
referred to as optimizing selection.
In light of the constraints on maximum offspring size that arise from the pelvic girdle of lizards, we are prompted to ask if such constraints operate on other vertebrates. Let's look at a problem more close to home. Humans invest an inordinate amount of energy into their young before they are born, as well as a large amount in extended parental care. The duration of parental care in humans after birth which can be more than two decades. There is not much data to inform us how human parental investment after birth leads to offspring success. However, data is available on offspring size and problems during birth. The parturition problems experienced by lizards are a very general problem for all vertebrates that lay relatively large offspring. The problem with offspring size in humans is exacerbated by the large size of the cranium of the newborn relative to the size of the birth canal.
Karn and Penrose (1958) collected data from hospitals on the survival probability of offspring as a function of neonate size, and the duration of gestation (Schluter, 1988). Length of gestation confounds neonate size. Premature babies are usually much smaller than babies born at full term. Thus, neonate size is expressed as the difference in size from the mean of the population after removal of factors such as length of gestation.
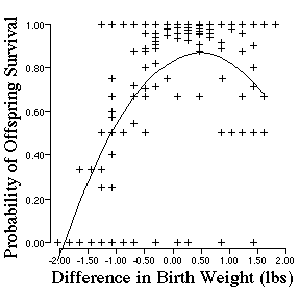
Figure 3.9. Probability of human infant survival after birth is
affected by neonate size. Original data is from Karn and Penrose and reanalyzed
by Schluter (1988). Data are standardized relative to average infant size
at birth which is located at 0.
Two patterns emerge from the analysis of selection on human birth weight. First, there is significant stabilizing selection on neonate size. Small infants and large infants die during child birth at a higher rate than average-sized infants. Second, there is also a directional component to selection. Notice that the optimal infant size is one-half of a pound higher than the average infant size in the population. The pattern of low survival of large offspring undoubtedly has different causes than the probability of low survival of small offspring. For example, small offspring may have had high mortality because of inadequate nutrition during gestation. Conversely, large offspring may have died because of the large diameter of the cranium relative to the pelvic girdle and its effects on duration and difficulty of labor.
Disruptive selection is perhaps the most elusive mode of selection. Despite
the paucity of actual examples of disruptive selection, the process is thought
to play a major role in the process of speciation or the origin of new species
(Templeton, 1982). The action of disruptive selection is much more complicated
than the action of directional selection in which a single agent of selection
shapes a trait. Furthermore, the action of disruptive selection is likely
to be more complicated than stabilizing selection which is sometimes composed
of counterbalancing trade-offs. Disruptive selection acts against individuals
in the middle of the phenotype distribution and tends to favor individuals
in the extremes. A simple form of disruptive selection occurs on a single
locus with two alleles when heterozygous individuals are at a disadvantage
relative to the two homozygous classes (see Side Box
2.1, underdominance). In the case of such underdominance in fitness,
selection favors the more extreme homozygous classes.
If the action of disruptive selection is relatively weak it tends to increase the representation of individuals in the tails of the distribution. The distribution will appear to be more flat, with longer tails after selection compared to distribution before selection. If disruptive selection is relatively strong, it will lead to two distinct modes which are separated by a "fitness valley" where selected phenotypes have been removed by selection.
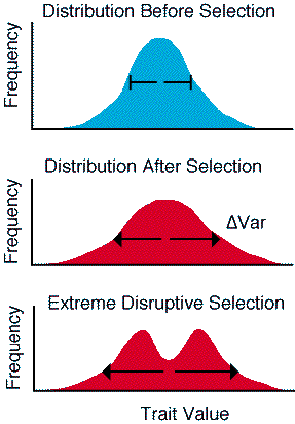
Figure 3.11. The action of disruptive selection on the phenotype
distribution.
Recall the pedigree analysis of the African Finch in which a simple mendelian locus controlled bill morphology. Tom Smith (1987, 1993) has also studied juvenile and adult survival over a number of years to measure natural selection on morphology and feeding behavior of the finches. In the case of the Finches, the trait that is under selection is not a polygenic trait as in all of the previous examples. Beak size is a relatively discrete trait, however, this is still variation about each of the modes. The causes of such variation could be environmental, or perhaps due to the additive genetic effect of other loci which have much smaller effects on morphology and feeding behavior.
From Smith's data set on the survival of birds as a function of upper and lower bill width's it is clear that disruptive selection tends to eliminate the intermediate-sized birds in the population. However, selection also tends to eliminate the extreme tails of the distribution as well in at least some age and sex classes (e.g., juveniles and adult females Fig. 12. A, B, D, and E). Finally, selection on adult males appears to be much weaker than selection on adult females.
Given the simple mendelian inheritance for beak size, it is clear that disruptive selection tends to maintain two distinct bill morphs by eliminating birds with intermediate-sized bills. Moreover, Selection for the most extreme (e.g., largest and smallest) individuals in the population would tend to keep the bill size of African finches within a species typical range. Natural selection on beak size in seed cracking finches can be traced directly to feeding performance of the two morphs on different sized seeds. The behavioral differences between morphs with regards to their feeding preferences can be traced directly to their survival in the wild. Both modes experience disruptive selection which refines the differences between morphs. In addition, each mode or morph also experiences a form of optimizing selection, at least in juveniles and adult females (Fig. 12, A, B, D, E). Tom Smith (1987, 1993) has captured the essence of the process of adaptation. Finch morphs have different seed preferences because it is highly adaptive.
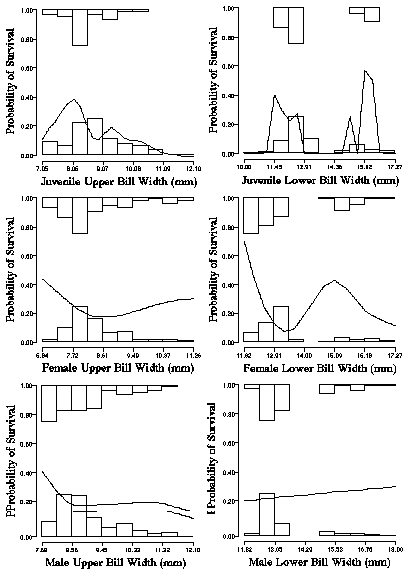
Figure Legend. Disruptive selection on bill morphs of the African Finch, Pyrenestes ostrinus. The fitness or survival of juveniles, adult females, and males was either 0 (dead) or 1 (survived) across one year. The histograms at the top of the graph gives the distribution of beak sizes for individuals that survived, relative to the histogram at the bottom that which gives the distribution of those females that died. The curve describes the probability of survival as a function beak size. Individuals with intermediate sized beaks sit in a fitness valley and have lower fitness than individuals with large or small beaks. While the pattern of disruptive selection is common, it is not found for both the upper and lower bills or for all age and sex classes.
A polymorphism is usually a mendelian trait that is maintained in a population in two or morph phenotypes. Overdominance provides one mechanism for maintaining variation. Frequency dependent selection provides another powerful mechanism for preserving variation.
The Rift Lakes of Africa are an evolutionary playground. Within a very short period, perhaps as little as 10,000 years, a tremendous number of species of Cichlid fish have evolved by the process of speciation. The kinds of feeding behaviors found in the lake are stunning. Some cichlids feed in the pedestrian manner typical of fish, scraping algae off rocks or chasing after other fish. Other fish are egg robbers. The egg robbers do not eat eggs that other fish have laid into the lake; instead egg robbers have specialized on another cichlid that is called a mouth brooder. Mouth brooders swallow their own offspring but do not digest them, they keep them safe out of harms way in their mouths. Egg robbers get the mouth brooders to cough up their eggs. When they do, the egg robbers swoop in for the kill. There are over 250 fish in Lake Victoria, and most fish have a different way of making a living.
One of the strangest ways of making a living is found in the behavior of Perissodus microlepis, a cichlid fish that specializes in eating scales (Hori 1993). Perissodus microlepis will swoop in on its prey from the blind side and eat some scales. The scale-eater is a classic partial predator that feeds only on part of its prey, but leaves the fish otherwise intact to learn something from the encounter. What is strange about this behavior is that it leads to a curious evolutionary cycle from an interplay between the predator's genes, and the prey's learning and reinforcement. At any point in time, there are two kinds of scale-eaters. One is always slightly more common than the other. In 1982, left-jawed scale-eaters were the most common. The prey are more often attacked on their right flank by a scale-eater with a jaw that curves to the left, so the prey learns to look to the right when being vigilant to attack. While the prey learn to look right, they leave their left flank exposed to the scale-eater with a jaw that curves to the right. This gives the rarer right-jawed morphology an advantage, and they do slightly better that year. The left-jawed morph does slightly worse, because the prey is vigilant to attack from the right flank attack, and the left-jawed morph declines in frequency.
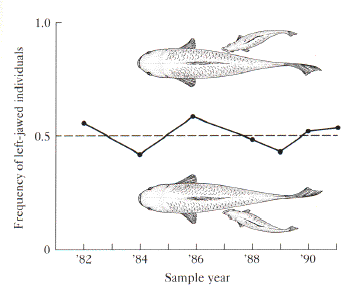
Figure Legend. The frequency of the scale-eating cichlid, Perissodus microlepis, oscillates around 50%. Each year, the prey species learn to look over a particular "shoulder" to guard against predation by the scale-eaters. The rarer morph (e.g., Left-jawed in 1984) has an advantage and increases in frequency. The following season the other morph becomes rare (e.g., right-jawed in 85) in the following season (Hori 1993), drawings from Alcock 1988).
A lopsided jaw makes it easy to eat scales on one side of the prey, but it is completely ineffective on the other side of the prey. The functional constraints on a predator's foraging behavior leads to an interesting evolutionary chase of sorts. Consider 1984 when left-jawed fish were below 50% in the population, and the right-jawed fish were above 50%. The prey learn to associate left side with attack, because right-jawed fish are common. Predators with a left-jawed form can successfully swoop in on the preys exposed right flank. These left-jawed fish have more resources, and thus produce more offspring. The next year, the proportion of left-jawed scale-eaters increases. They are so successful that prey now learn to look right. Now the right-jawed predators that attack from the left have an advantage. The population of predator and prey oscillate over very short evolutionary time because of strong frequency-dependent selection. The prey's behavior is driven by rapid learning and reinforcement for the side of most frequent attack. The predator's behavior and genetics drive them to be more or less successful depending on whether they are common or rare. The rare form always has an advantage.
The frequency-dependent advantage of the rare prey item need not be restricted to this spectacular case of alternative feeding morphology. Frequency-dependent prey selection may be a common feature of many interactions between cryptic prey and their predators. Because many predators may form a search image (see Chapter 6), they will tend to form a search image for the most common prey encountered in the environment. When this occurs, they will begin to feed on that particular cryptic item, and not even notice the other cryptic prey. They continue depleting the common cryptic prey item until it too becomes rare. At this point, they may stumble on an alternative and more common cryptic prey item, and the predator switches their search image.