Introduction to Genetic Terms and Mendelian Traits
Roving versus sitting in Drosophila larvae (deBelle & Sodolowki)
B. Introduction to Natural Selection and Sexual
Selection
Directional Selection and the Selection Differential
Parental Investment in Lizards (Sinervo), Humans (Karn & Penrose)
Data on bull frog males (Howard)
Selection on Correlated traits
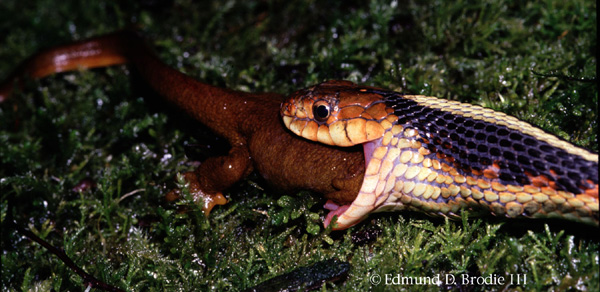
Garter snake resistance to tetrodotoxin produced by prey (Brodie III)
We can look towards a singular, natural starting point in our search for factors in our proximate chain of behavioral causation -- genes. It is dogma that alleles at a gene get translated into proteins, these proteins are used to build cells, the cells interact directly with other cells or produce "messengers" that facilitate the interaction at distance, and the cells act to produce behaviors. Those behaviors have functional or selective consequences, and the species evolves. For the moment we will ignore all of the details between genes and the selective consequences. We will see how genes coding for behavior evolve. Before we begin this quest, we need to be armed with a few of the terms of genetics.
There is a mapping between genotype and phenotype, but it is quite complex. It is rare that one gene will code for one phenotypic trait. There is also a mapping between one phenotypic trait and another. We have several concepts that describe how genotype can be related to phenotypic traits.
Many of the issues of mendelian inheritance and animal behavior are found in the example of roving versus sitting larvae in Drosophila. Marie Sokolowski generated to strains of larvae and then carried out some illuminating crosses. If one takes parental rover males and crosses them to sitter females, one produces progeny (F1) that are largely rovers with few if any sitters. Already this suggests that sitter is recessive to rover (or rover is dominant to sitter). The clincher is when you cross F1 with F1. These offspring produce rovers and sitters in a 3:1 ratio -- exactly the pattern one expects if the F1 are all heterozygous for rover and sitter alleles. You would expect their progeny to be comprised of 1:2:1:
| 1 | rover/rover |
| 2 | rover/sitter |
| 1 | sitter/sitter |
Lets do the Punnet squares:
P0 (Parents) : sitter/sitter (sire) X rover/rover (dam) -> all F1 (offspring) are rover/sitter
because rover is dominant all offspring are rovers.
F1 X F1
genotype of first parent | |||
| R | S | ||
| genotype of second parent | R | RR | RS |
| S | RS | SS | |
I will discuss this in more detail later, but researchers (Brown et al) have used experiments to knock out maternal behavior in mice. A single gene knock out destroys the parental tendencies in female mice. If the gene is added back to the fosB- strain, parental behavior would be restored.
Do a Punnet square for two genes each of which has two alleles (Aa and Bb). Do the punnet square for a heterozygous individual crossed to a heterozygous individual and imagine that each locus is co-dominant for the two forms of the allele. If each A adds 1 foot to your height and each B adds one foot to your height (e.g., a, b add nothing). Then how many height classes are there? This is a simple example of polygenic inheritance. Many behavioral traits may be due to many genes each of which act additively to produce the phenotype. Selection on nest building appears to be a trait governed by many genes and this example is elaborated in great detail below: Selection on nest building in mice (Lynch)
The end result of artificial selection for females that build large and small nests. Photo by L. C. Drickamer and from Drickamer and Vesseys book on Animal Behavior.
An explanation of drosophila gynandromorphs (Benzer) as explained in Alcock. Bottom line: all it takes is a little of the male genes turning on in the upper brain and another individual with female genes turning on the posterior abdomen --> the upper brain "male" will pursue the posterior abdomen "female".
Correlations for IQ among various family members:
| Category | Predicted Correlation if solely due to genetic cause | Actual Median Correlation | Why they differ |
| Identical twins reared together | 1.00 |
0.85 |
The environment of each twin leads to variation that is not genetic |
| Identical twins reared apart | 1.00 |
0.67 |
The environment is even more different than twins that are reared together who share some common household features in common. |
| Fraternal twins reared together | 0.50 |
0.58 |
Fraternal twins share a common womb environment which might inflate their resemblance and they are reared at the same time. |
| Siblings reared apart | 0.50 |
0.45 |
Some environmental differences in the rearing environments. |
| Non-biological sibling pairs | 0.00 |
0.29 |
Common rearing environment |
| Parent-biological environment | 0.50 |
0.39 |
Scientific evidence of the generation gap |
| Parent-adopted child | 0.00 |
0.18 |
The parent trying to push their views on the child. |
Natural selection is the differential survival and/or reproduction of organisms as a function of their physical attributes. Because of their phenotypes (the amalgam of traits that make up an individual), some individuals do better than others. The concept of selection is central to Darwin's theory of evolution, and the theories comprising the field of animal As a result, tremendous effort has been put into different forms that selection may take and some ways of measuring it. We will introduce you to two of three primary modes of selection on differential fitness:
Sexual selection is conceptually very similar to natural selection. Traits that are under sexual selection can also be subject to the three modes that are found for natural selection. Darwin considered any trait that was related to the number of mates an individual obtained to be under a special kind of selection that he called sexual selection. Such variation in the number of mates can arise from two source:
To aid you in visualizing selection, I have written a program for the Macintosh computer that helps visualize natural and sexual selection surfaces. If you did not make it to lecture, you could use the program MacFitness to visualize selection. You will need to "download" the software. Computers on campus should be able to autotranslate the software for you. If you made it to lecture then there is really no need to use the software -- I just provide it for those of you that want to play around with it (remember it is not bombproof).
download MacFitness folder for the Macintosh
(NO NEED TO DOWNLOAD)
We will use the software program MacFitness to visualize the relationship between a trait and survival or reproductive success.
The MacFitness software program allows you to visualize natural selection by fitting different kinds of curves. One method of describing fitness functions is with equations. A straight line might provide an adequate description of selection if selection is directional or fitness is linearly related to phenotype.
 A linear regression describes directional selection
and provides the best fit linear relationship between the trait being selected
and the measure of fitness (survival, number of mates, etc). For traits
such as number of mates it is easy to understand how the linear relationship
can be used as a predictor of fitness for a given trait. However, for traits
like survival which take on values that are either 0 (dead) or 1 (alive),
The linear regression describes how the probability of survival varies as
a function of the trait of interest. We will explore the relationship between
survival and reproduction and the traits that individuals express.
A linear regression describes directional selection
and provides the best fit linear relationship between the trait being selected
and the measure of fitness (survival, number of mates, etc). For traits
such as number of mates it is easy to understand how the linear relationship
can be used as a predictor of fitness for a given trait. However, for traits
like survival which take on values that are either 0 (dead) or 1 (alive),
The linear regression describes how the probability of survival varies as
a function of the trait of interest. We will explore the relationship between
survival and reproduction and the traits that individuals express.
Howard collected data on territorial bull frogs. He measured their body
size and then assessed how many mates a male obtained as a function of his
size. Open up the file "frog.logsize.W1". Use the Menu item Execute
to draw the linear regression. Does the number of mates a bull frog get
vary as a function of his body size? Larger frogs obtain more mates.
Evolution is the change in traits over generations. A useful measure
of natural selection is the change in the mean of the phenotype as a result
of an episode of selection, but before the next generation of progeny is
produced. The selection differential describes the strength of selection
and is related to the slope of the regression described above. The selection
differential compares the mean of the population before or after selection.
Selection on the mean is directional selection. If you compare the difference
between survivors and the total population you get the selection differential.
Compute the mean of the survivors. This shows you the females that survived,
y axis = 1, laying their clutch on the top of the graph (e.g., a histogram
describes the distribution of survivors) and those that died, y axis = 0,
Compute the mean of all the individuals from the following raw data which
you see in the graph. Compute the mean of those that survive.
The selection differential = mean after selection - mean before selection.
Is the selection differential large? Is it significant? To test for significance
use the two sample t-test under the statistics heading of MacFitness. If
the value for a t test (the simplest comparison that you can make), t-value
> 1.96, then the selection differential is significant. What does significance
mean? Well the P-value or probability value for any statistical test gives
the probability that the pattern you see in the data could have occurred
by chance alone. That is the Null hypothesis is true and the relationship
between survival and the trait of interest is truly the product of random
forces -- and not the product of selection. Thus, a p-value=0.05 implies
that 5% of the time one might see data line up by chance alone in a pattern
that seems to lead to higher or lower survivorship as a function of the
trait of interest. This is the scientists way of expressing how certain
they are that the pattern they see in the data is not due to random processes.
Response to selection is R=heritability x s, where s = selection
differential.
The selection differential can also be derived from the slope of the regression of the trait on fitness in addition to the simple case where it is computed as the difference between two means (before vs after selection). Thus, the response to selection is a function of the heritability of a trait and the strength of selection on the trait. With either low heritability or weak selection, Response to selection is slow compared to strong heritability or strong selection.
In an artificial selection experiment, the research applies a known
selection differential to the experimental population. For example, Carol
Lynch selected for females that built big and small nests in a multi-generational
artificial selection experiment. You can see that she was more successful
in getting very big nests for obvious reasons, but the plateau or slowing
seen in both lines is evidence that the Response to selection was dropping.
She was applying the same selection differential each generation, thus because
R was dropping and s stayed the same, and R=h2s defines the relationship
between Response to selection, h2, and s, we know that h2 must be dropping
with each generation. Because h2 is proportional to additive genetic variation,
this selection experiment was destroying additive genetic variation. High
selected lines were becoming fixed for lots of high alleles, and low selected
lines were becoming fixed for lots of low alleles. Selection depletes additive
genetic variation. Only mutation will restore the depleted additive genetic
variation within any given line. However, because each line has probably
fixed for different alleles at the loci governing the trait nesting, then
if we interbreed lines that have been selected high we will recoup much
new additive variation and be able to go beyond the selection plateau a
little further. Another reason for the plateau is counter balancing selection
against either large or small nests (e.g., offspring survival).
 The pattern of selection gets a little more complicated
for stabilizing selection in which a quadratic (2nd order polynomial equation)
is used to estimate the shape of selection. Use the command execute to draw
the curve for probability of survival as a function of egg size where the
relationship between the trait of interest and fitness is "stabilizing".
Does the curve describe the pattern you see. Look at the shape of distribution
of survivors vs those that die. Which distribution is broader (e.g., has
greater variance). Who tends to die in the population?
The pattern of selection gets a little more complicated
for stabilizing selection in which a quadratic (2nd order polynomial equation)
is used to estimate the shape of selection. Use the command execute to draw
the curve for probability of survival as a function of egg size where the
relationship between the trait of interest and fitness is "stabilizing".
Does the curve describe the pattern you see. Look at the shape of distribution
of survivors vs those that die. Which distribution is broader (e.g., has
greater variance). Who tends to die in the population?
Is the stabilizing term significant? To answer this question, you would
test for a change in variance across the episode of selection. Fortunately
for you, MacFitness calculates the answer quickly. Use the Statistics menu
item and choose the Regression (selection) coefficients item. This computes
the F-value which is the statistic used to test for significant regression
coefficients. What is the F-value for the quadratic term. If the F-value
is >4.14 the stabilizing selection is significant.
Now that you know the form of selection of adult female lizards, construct a hypothesis for why some females are dying at a higher frequency than others as a function of the size of eggs that they lay?
 Now lets look at a more close to home example of natural
selection. Karn and Penrose collected data on the survival of human babies
as a function of their birth weight. The data file we have is for survival
as a function of how much bigger or smaller the babies are from the average
size (in pounds). Open the Karn and Penrose data. Note that probability
of survival is not just 0 and 1. For this data, values with the same offspring
weight were use to compute an average survival for that weight class. Thus,
the data represents the probability of survival as a function of birth weight.
Now lets look at a more close to home example of natural
selection. Karn and Penrose collected data on the survival of human babies
as a function of their birth weight. The data file we have is for survival
as a function of how much bigger or smaller the babies are from the average
size (in pounds). Open the Karn and Penrose data. Note that probability
of survival is not just 0 and 1. For this data, values with the same offspring
weight were use to compute an average survival for that weight class. Thus,
the data represents the probability of survival as a function of birth weight.
Describe the shape of the data and predict the kind of selection.
Biologically, what is happening to selection on birth weight? This data is over 4 decades old. What has happened in recent years that might change the pattern of natural selection on human birth weight.
 We will deal with disruptive selection greater detail
next week. However, lets take a quick peak at some data now. Open up the
file pyrenestes_lower_female. My friend Tom Smith collected data
on Finches in Africa, and there are two types in this population: small-billed
morphs and large-billed morphs. These types are controlled by a simple mendelian
locus. Can you see the two types reflected in the distribution of those
that lived for one year and those that died as a function of lower bill
width. From the distributions try to predict the pattern of selection.
We will deal with disruptive selection greater detail
next week. However, lets take a quick peak at some data now. Open up the
file pyrenestes_lower_female. My friend Tom Smith collected data
on Finches in Africa, and there are two types in this population: small-billed
morphs and large-billed morphs. These types are controlled by a simple mendelian
locus. Can you see the two types reflected in the distribution of those
that lived for one year and those that died as a function of lower bill
width. From the distributions try to predict the pattern of selection.
How would you characterize selection?
Now we will use the non-parametric curve. Such non-parametric methods
of curve-fitting are useful for deciding whether data are appropriate for
a parametric model (e.g., ordinary regression). A popular method is known
as the cubic spline. The method is roughly the equivalent of calculating
a running average of fitness along the phenotype axis. Imagine that fitness
is plotted on a graph, and you construct a window that is a given width
along the phenotype axis. Begin with the window all the way on the left
side, and calculate the mean values of fitness in the window. Plot the mean
against the middle of the window. Move the window a bit to the right, and
repeat the process. Continue until the window reaches the far right side
of the axis. That is what is reflected in the non-parametric curve that
MacFitness draws.
Who lives and dies as a function of their bill width? look carefully at the curve which describes probability of survival as a function of bill size.
The lifetime of an organism can be partitioned into periods or events that are episodes of selection. Selection rarely occurs in one single event. Selection can act at the various stages of a life history. We will examine some data that Howard (1979) collected on bull frogs. Fitness at each episode can be described, and the lifetime fitness of the organism is calculated as the product of its fitness at the individual episodes.
W(lifetime) = W1 x W2 x W3 or
W(bullfrog male) = Number of mates x offspring per mate x survival of
offspring on territory.
Some selection episodes may shape lifetime fitness more strongly than
others.
The data files labeled W1, W2, and W3 are the fitness episodes acting on male body size of bullfrogs.
A) We will use MacFitness to characterize the fitness functions describing each episode. Is selection on the mean (e.g., directional selection), variance (e.g., stabilizing selection) or both.
B) Speculate on selection episodes that were not studied. Specifically, if bigger is always better, suggest reasons why these frogs have not evolved to a large size than they are?
The following information was excerpted and edited from Butch Brodie III's home page. Visit his site and explore other studies that he is currently carrying out.
 E.D. Brodie III (University
of Kentucky) and E.
D. Brodie, Jr. (Utah State University) have investigated the evolution
of toxicity in the newt Taricha granulosa and resistance to this
toxin by the garter snake Thamnophis sirtalis. They demonstrated
heritable variation and thus the opportunity to respond to selection favoring
resistance to newt toxin (Brodie and Brodie, 1990, Evolution). Moreover,
populations of garter snakes differ greatly in their level of resistance
to tetrodotoxin (Brodie and Brodie, 1991, Evolution).
E.D. Brodie III (University
of Kentucky) and E.
D. Brodie, Jr. (Utah State University) have investigated the evolution
of toxicity in the newt Taricha granulosa and resistance to this
toxin by the garter snake Thamnophis sirtalis. They demonstrated
heritable variation and thus the opportunity to respond to selection favoring
resistance to newt toxin (Brodie and Brodie, 1990, Evolution). Moreover,
populations of garter snakes differ greatly in their level of resistance
to tetrodotoxin (Brodie and Brodie, 1991, Evolution). 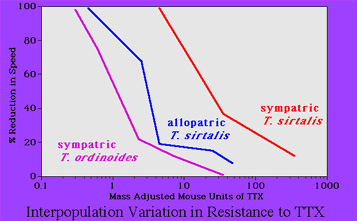 Some populations have little resistance (see
figure) others have a lot of resistance. Their current efforts focus on
the apparent costs (in terms of reduced locomotor performance) of evolving
that resistance. For reasons that are as yet unclear snakes that evolve
high resistance, appear to crawl more slowly than low resistance populations.
Perhaps the gene involved in detoxifying prey are in some way pleiotropically
related to locomotor performance.
Some populations have little resistance (see
figure) others have a lot of resistance. Their current efforts focus on
the apparent costs (in terms of reduced locomotor performance) of evolving
that resistance. For reasons that are as yet unclear snakes that evolve
high resistance, appear to crawl more slowly than low resistance populations.
Perhaps the gene involved in detoxifying prey are in some way pleiotropically
related to locomotor performance.
The work that the Brodies carried out parallels the work by Stevan J. Arnold on the ability to feed on Slugs and preference for slugs (see Alcock). In both cases, those populations with the noxious prey or "sticky" difficult-to-swallow prey have evolved the ability to ingest the prey, and have also evolved a taste for them. In the case of slug-feeding snakes, they prefer slugs if they come from coastal areas. However, if they come from inland areas they prefer fish and frogs. Thus behavioral preferences have evolved in concert with the ability to ingest noxious or otherwise difficult prey. However, in the case of detoxifying the poisons of prey, it might involve trade-offs with other aspects of organismal physiology such as crawling performance.
 Functional interaction
may create suites of traits on which selection acts simultaneously. Selection
may act on many aspects of the phenotype. Correlational selection for particular
combinations of traits may explain patterns of association between behavioral
and morphological traits. Mark-recapture work in a natural population of
the garter snake Thamnophis ordinoides detected correlational selection
for combinations of color pattern and antipredator behavior: individuals
with striped
Functional interaction
may create suites of traits on which selection acts simultaneously. Selection
may act on many aspects of the phenotype. Correlational selection for particular
combinations of traits may explain patterns of association between behavioral
and morphological traits. Mark-recapture work in a natural population of
the garter snake Thamnophis ordinoides detected correlational selection
for combinations of color pattern and antipredator behavior: individuals
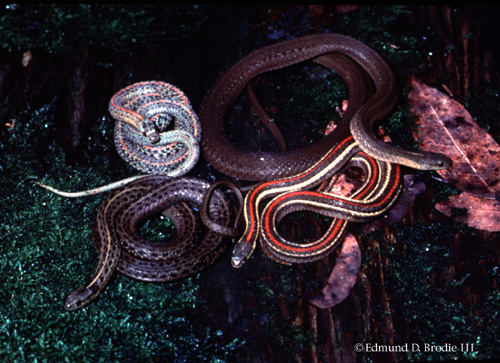
with striped 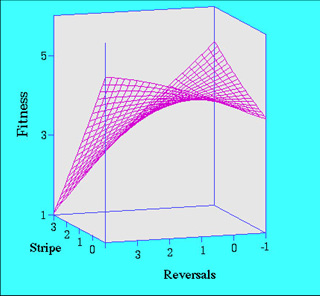 patterns
that flee directly and those with spotted or unmarked patterns that perform
evasive reversals during flight have a higher probability of survival than
others (Brodie, 1992, Evolution). If you are a snake, you have to have a
nice match between your color pattern and your escape behavior to be effective.
Such selection might lead to strong associations between the genes for escape
behavior and color pattern because selection favors combinations of alleles
at the separate loci governing the traits. Only snakes with spotted pattern
and perform reversals survive well and thus selection creates snakes that
tend to be fixed for alleles for reversals and alleles for color pattern.
Conversely, only snakes with stripes and no reversals have high survival
and selection favors individuals that are fixed in the other alleles. You
don't see many snakes with reversals and stripes or no reversal and spots.
This process leads to color pattern and escape behavior becoming genetically
correlated in some natural populations of garter snakes (Brodie, 1989,
Nature; 1993, Evolution).
patterns
that flee directly and those with spotted or unmarked patterns that perform
evasive reversals during flight have a higher probability of survival than
others (Brodie, 1992, Evolution). If you are a snake, you have to have a
nice match between your color pattern and your escape behavior to be effective.
Such selection might lead to strong associations between the genes for escape
behavior and color pattern because selection favors combinations of alleles
at the separate loci governing the traits. Only snakes with spotted pattern
and perform reversals survive well and thus selection creates snakes that
tend to be fixed for alleles for reversals and alleles for color pattern.
Conversely, only snakes with stripes and no reversals have high survival
and selection favors individuals that are fixed in the other alleles. You
don't see many snakes with reversals and stripes or no reversal and spots.
This process leads to color pattern and escape behavior becoming genetically
correlated in some natural populations of garter snakes (Brodie, 1989,
Nature; 1993, Evolution).
Howards data set on bull frogs already introduced us to sexual selection on bull frog male size. Sexual selection is distinguished from natural selection by Charles Darwin. Sexual selection is designated as variance in the number of mates. The kernel of the argument is as follows:
Note: this is not necessarily always the case in the animal kingdom. As we will see in upcoming lectures, in pipefish males are limiting because they brood the offspring in a pouch. In this case females compete for mates, and in some pipefish species, females are more brightly colored than males.
Today we will explore Female Choice as a model for sexual selection. This theory was original proposed by Sir Ronald Fisher in which he believed that a correlation would be set up between genes for female choice and the genes for male traits, which would lead to a Runaway Process.
We will need to understand the theory of runaway sexual selection in order to understand how such processes my lead to rapid speciation and.
Let us assume that females come in two types:
Notice that the ornamented male has a fitness of 3/2 and the plain male has a fitness of 1/2.
What happens each generation is that both the gene for female choice and the male trait become correlated. Note that 1/2 the progeny have both genes for choice and the exaggerated trait.
If we continue this process, one more generation, all of the daughters of the choosy females have both the choice gene and the male trait gene. This means that females will be producing sons and daughters with both choice and exaggerated trait genes together. Because the exaggerated males have an advantage, Female Choice and the male trait spread, and they spread together linked by assortative mating, almost like a wild fire, or as Fisher termed a Runaway Process.
More importantly the genes for female choice and the genes for the male trait become linked in the progeny (even though they are not on the same chromosome). Such linkage by assortative mating leads to the runaway, because the better males who are chosen with high frequency produce lots of daughters who are likewise quite choosy.